Membrane Technology for Air Handeling Units

Blog

Products

Filtration Services

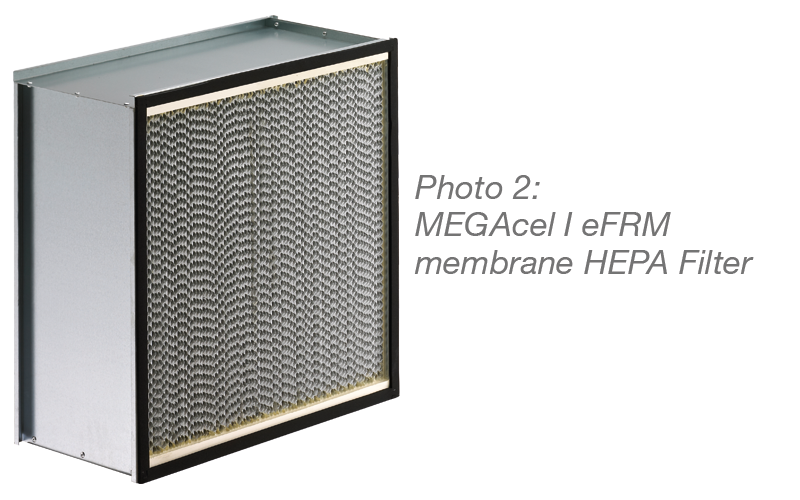
Thanks to its unique membrane technology, the eFRM HEPA filter medium has been the medium of choice for numerous end users in the life science and microelectronics industries for several years. In addition to the low pressure drop, the focus in these segments is on risk minimization through high mechanical stability and chemical resistance.


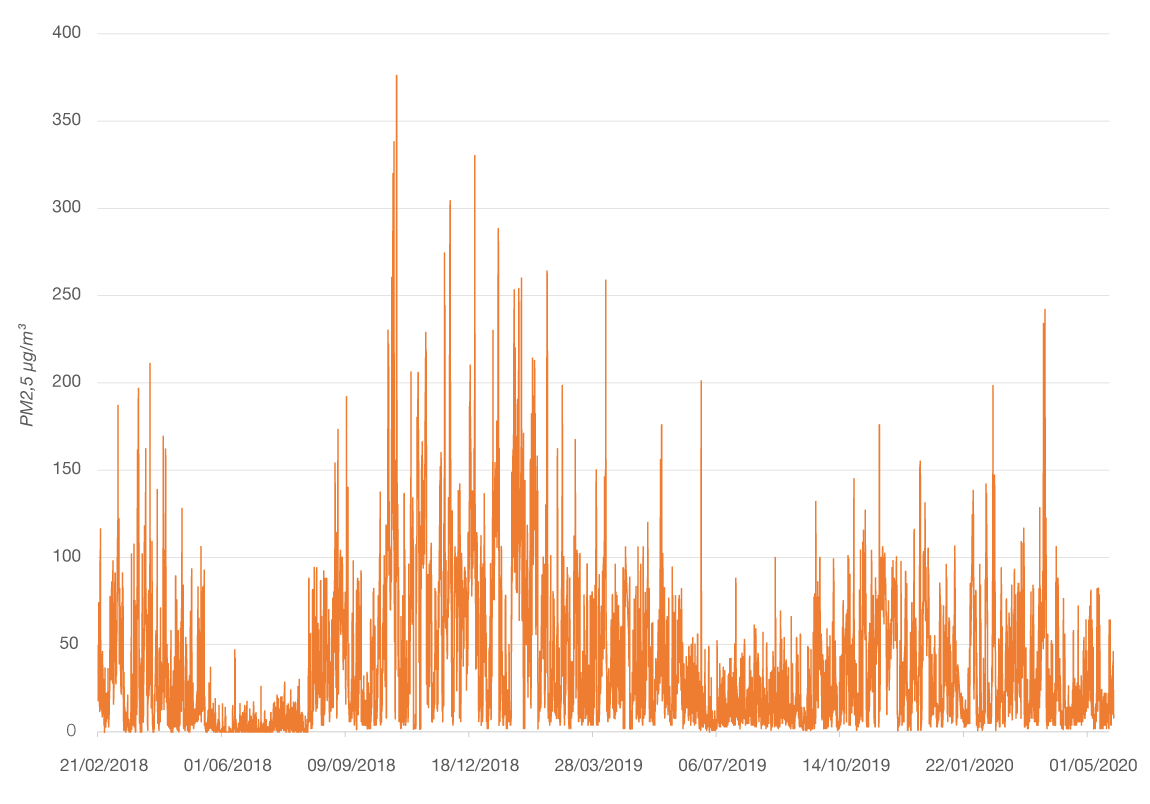
Due to the extremely low pressure drop, the eFRM filter medium is predestined for use in high-flow HEPA filters such as those used in ventilation systems for high-purity environments. To investigate this application, a test was conducted under real outdoor air conditions. For this purpose, eFRM HEPA filters were subjected to a "1000 days" long-term test in parallel to conventional glass fiber HEPA filters in a two-stage filter system using the AAF test container. After a description of the test container, the article deals with the short- and long-term behavior of the filters.

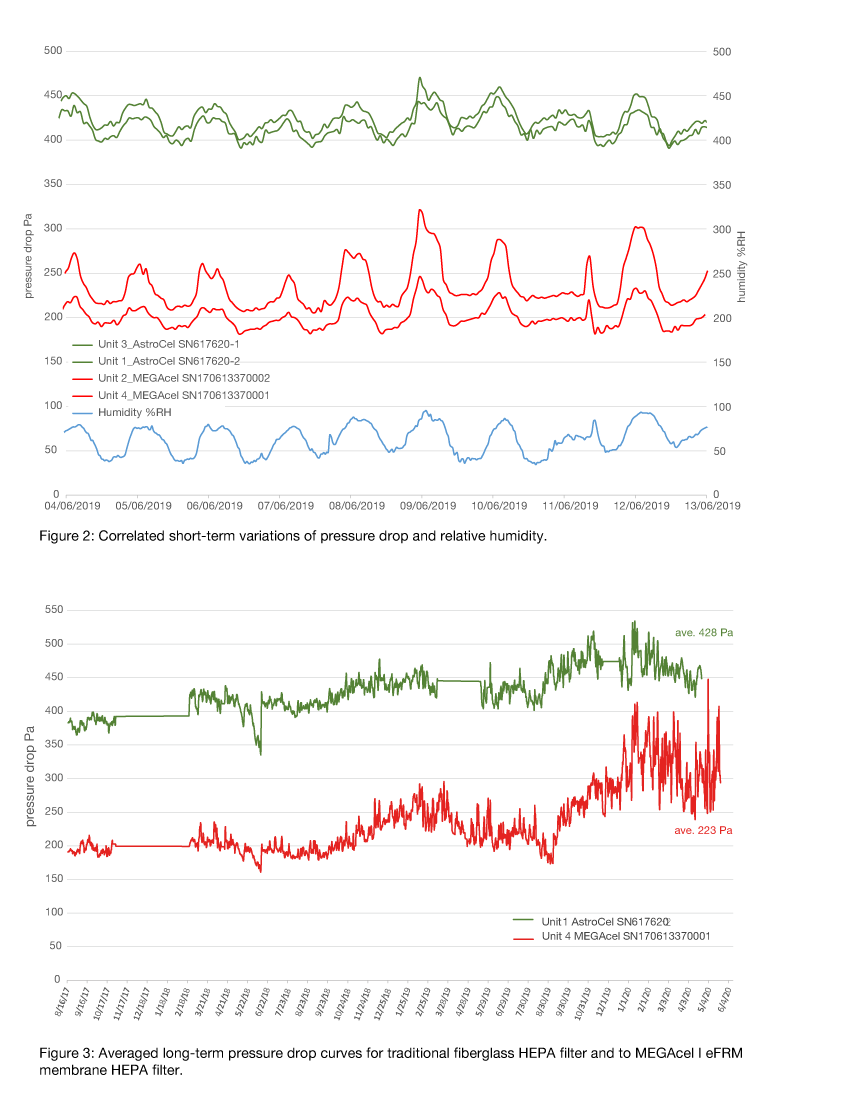
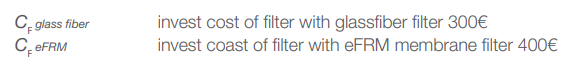
On a short-term time scale, interesting correlations between the relative humidity and the pressure drop of the HEPA filters can be seen. On the long-term scale, the advantage of the low pressure drop of the eFRM HEPA filters is shown to be maintained even when 100% fresh air is used. Furthermore, the paper discusses the economic implications resulting from the favorable pressure drop characteristics of eFRM HEPA filters compared to glass fiber-based HEPA filters.

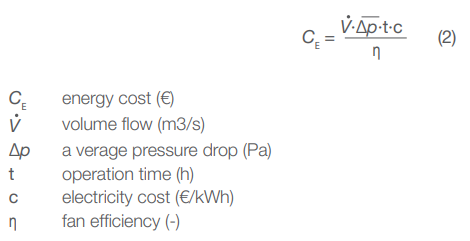
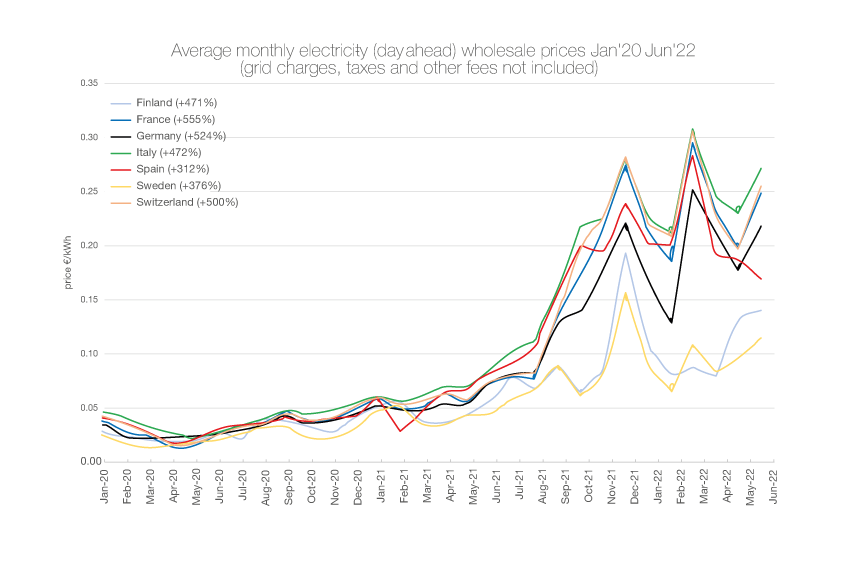
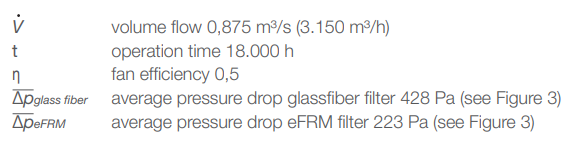
For this purpose, the operating costs as well as the "Total Cost of Ownership" are discussed, especially against the background of the differently increasing electricity costs in different countries. The energy costs from the end of 2021, on which this paper is based, now have to be adjusted upwards on a monthly basis, so the current cost benefits of using eFRM HEPA filters are likely to be higher than the values shown.

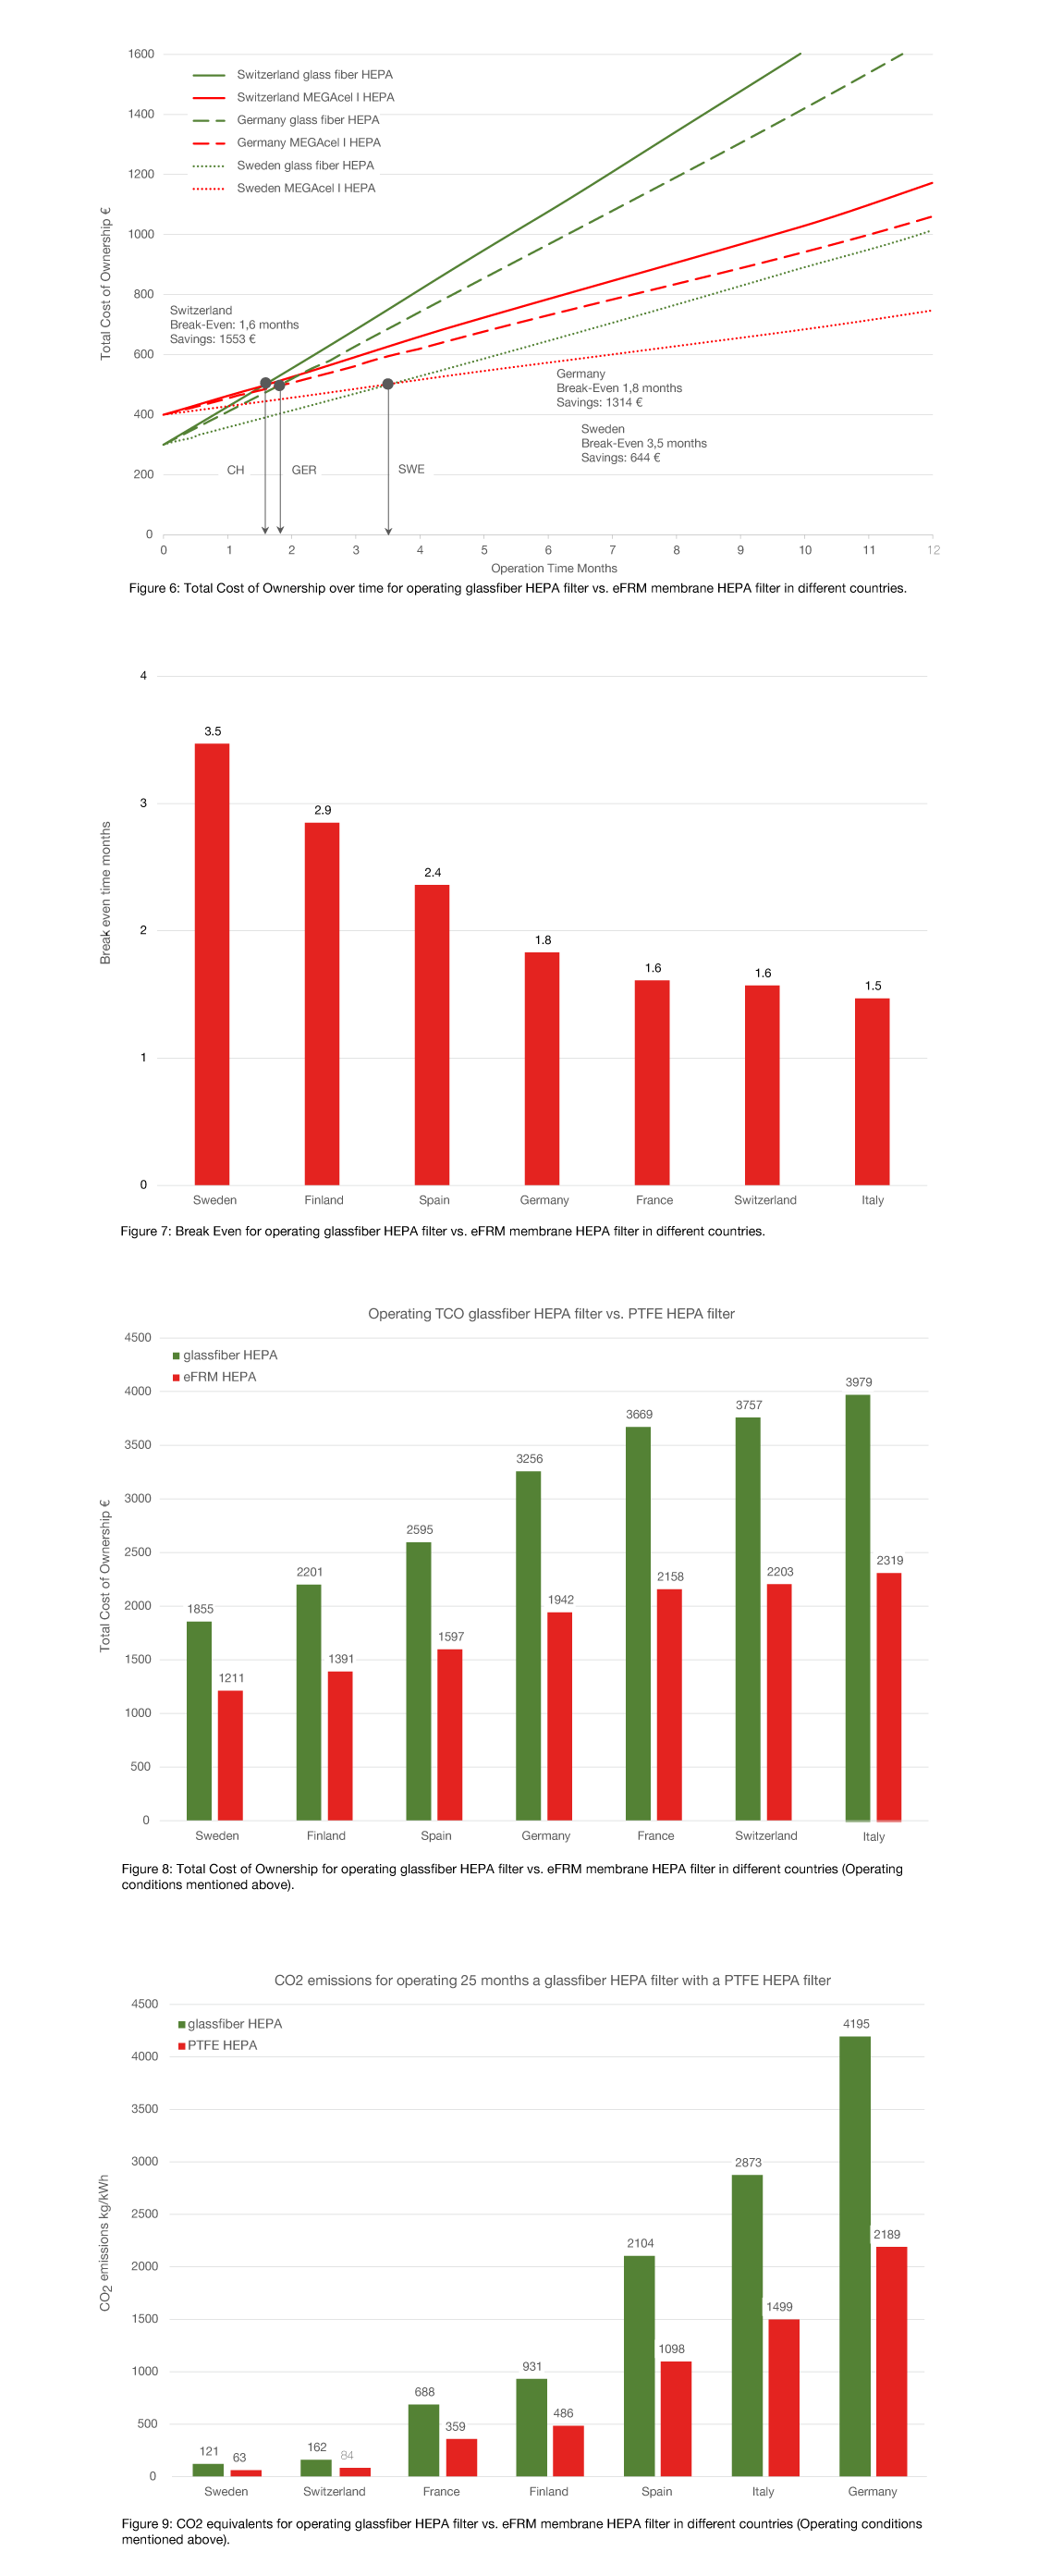
The carbon footprint during operation of the different filters will also be discussed. Although the carbon footprint (due to nationally different energy mixes) is very different between the countries, eFRM HEPA filters offer a significant advantage over conventional glass fiber HEPA filters. Thus, eFRM membrane HEPA filters are not only an economical, but also an ecologically sound technical solution for particle filtration in high-purity environments.

In the AAF 40' test container, four filter systems, each with two stages, are installed in parallel. Each filtration system has a VariCel EcoPak ePM1 55% compact prefilter with glass fiber media in the first stage. In the second stage, traditional H14 glass fiber HEPA filters AstroCel I HC and H14 eFRM membrane HEPA filters MEGAcel I are installed in two filter systems each. The filter combination is therefore an ePM1 55% filter, directly followed by an H14 HEPA filter. The volume flow was monitored with volume flow orifices. The pressure drops of the volume flow orifices as well as those of the respective filter stages were remotely monitored using the AAF Sensor360® system. Also connected to the Sensor360® system was a commercial PM2,5 particle sensor at the air inlet of the container. A data logger for air temperature and humidity was also installed there. Photo 3 shows the test container in the Diniar plant in Olaine (Latvia). The pipes on the left side are the air outlets of the four filter systems inside the container.

In the first part of the test, the container was operated 24/7 in AAF plant in Emmen (The Netherlands) for 83 days, after an overhaul, the container was transported to the Dinair plant in Olaine (Latvia) and operated there 24/7 for 828 days. The filters were operated at a flow rate of 3150 m³/h. The volume flow was manually readjusted when necessary. The prefilters were operated up to the load limit, in one case even above it, so that the filter pack broke. The pressure loss was then above 550 Pa. They were replaced approximately every 3 months. By adding another prefilter in the efficiency range ePM2.5 or ePM10, the service life of the VariCel EcoPak ePM1 55% compact prefilter used could certainly be extended.

Temperature & relative humidity

The test container was exposed to significant seasonal fluctuations in temperature and relative humidity of inlet air. In winter, temperatures of -10°C were regularly reached, and in some cases even -20°C. This resulted few times in icing of the pre-filters (Photo 4). In summer, the peak temperatures were up to 35°C. Relative humidity was naturally low in winter, below 10%, but reached values up to 100% in summer. In the course of the day, relative humidity usually correlates reciprocally with temperature, i.e. it decreases as the air warms during the day and increases as it cools at night.

Particle concentration

The measured PM2.5 particle concentrations also show large seasonal variations (figure 1). The PM2.5 mean value was 37µg/m³. For the nearby Latvian capital Riga, the European Environment Agency indicates a PM2.5 mean value of 12µg/m3 for 2018- 2020. Both mean values are in the range >7.5µg/m3 and thus in the range of outdoor air category ODA 3 (outdoor air with very high concentrations of particulate matter) according to Eurovent guideline 4/23-2020, which considers the latest recommendations of the World Health Organization (WHO global air quality guidelines 2021). The measured PM2.5 peak values are in the range 200-370µg/m³. It cannot be ruled out that condensation effects at high relative humidity contributed to the peak values.

Temperature & relative humidity

In the course of the pressure loss it is necessary to distinguish short-term effects from the long-term development. Short-term pressure drop fluctuations were often observed during the day (Figure 2).

Obvious is the significant pressure drop difference between traditional glass fiber AstroCel I HEPA filters and the MEGAcel I eFRM membrane HEPA filters. The glass fiber filters are at a level of 400-450 Pa, while the MEGAcel I eFRM membrane HEPA is significantly lower at 180-320 Pa. A direct correlation was found between the increase in relative humidity and the increase in pressure drop. This pressure drop increase was observed for glass fiber filters as well as for eFRM MEGAcel I filters. It is reversible in both cases but is slightly higher in the case of eFRM membrane filters. The reasons could be condensation effects in the filter material itself but are still subject to ongoing investigations. The long-term pressure drop development must be distinguished from this.

Figure 3 shows the long-term development pressure drop development of traditional glass fiber HEPA filter compared to MEGAcel I eFRM membrane HEPA filter. Initial pressure drop of the MEGAcel I eFRM membrane HEPA filter is with 180 Pa less than half of the traditional glass fiber HEPA filter, which is in the range of 380 Pa. For both filters, there are periodic fluctuations in the pressure drop, which are somewhat larger for the MEGAcel I eFRM membrane HEPA filter compared to the traditional glass fiber HEPA filters. For clarity, the values in the above diagram are averaged over a few days. As the load increases, the pressure drop of both filters increases, but the values for the MEGAcel I eFRM membrane HEPA filter always remain significantly lower than those for the traditional glass fiber HEPA filter. Towards the end of the test, the pressure drop difference is still about 150 Pa.

Total Cost of Ownership (TCO)

For the cost-optimized operation of a filter system, the Total Cost of Ownership TCO must be minimized. This is essentially made up of the investment costs CF for the filters plus the energy costs for operating the fan CE which has to overcome the pressure drop caused by the filters.

Energy cost

The energy costs to be spent for the operation of the filter are directly proportional to the pressure drop of the filter:

Since in a filter installation the basic conditions such as volume flow, operation time, fan efficiency and electricity cost are usually given, the energy costs can only be reduced by selecting a filter with the lowest possible pressure drop. Figure 4 shows the electricity cost development in some European countries. They vary significantly from country to country. In connection with the COVID pandemic, they rose sharply throughout Europe in 2021. Although there was a slight recovery at the beginning of 2022, a significant recovery is not expected in the context of the Russian war in Ukraine. On the contrary, electricity costs are expected to remain high, if not even rising.

In June 2022, compared to January 2020, electricity costs were +376% in Sweden, +524% in Germany and even +555% in France. It should be noted that Figure 4 shows only wholesale prices. Depending on the volume consumed, they may be significantly higher for commercial or industrial customers. Grid charges and other fees must also be added. Neither of these are considered in Figure 4. The selection of a filter with the lowest possible pressure drop is therefore of central importance for the cost-optimized operation of a filter system.

Every power generation is accompanied by certain CO2 emissions. This is commonly referred to as the CO2 footprint. The level of CO2 emissions and thus the CO2 footprint depends on the energy mix of the electricity consumer. Fossil energy sources (coal, gas, oil) naturally generate higher CO2 emissions than regenerable energy sources (wind, sun, water). For the same electricity consumption, the resulting CO2 emissions therefore vary greatly from country to country. Table 1 shows the level of CO2 emissions from electricity generation in different countries. Naturally, countries with a high use of renewable energy sources or nuclear energy, such as Sweden, Switzerland or France, have relatively low CO2 emissions for electricity generation.

2020 Sweden Switzerland France Finland Spain Italy Germany
CO2 emissions (g/kWh) 9 12 51 69 156 213 311

Table 1: CO2 emissions from electricity generation in different countries [2].

Example

Let’s check energy cost, TCO and CO2 footprint in a concrete application assuming conditions as described for the container test. For that we’re assuming the following:

Due to the situation on the energy markets described above, we assume the wholesale prices for electricity in June 2022 and, for simplicity's sake, neglect all grid fees and other charges.

Electricity prices Finland Sweden Spain Germany France Switzerland Italy
June 2022 (€/kWh) 0,1403 0,1148 0,1694 0,2182 0,2487 0,2552 0,716
Increase vs. Jan 2022 +417% +376% +312% +524% +555% +500% +472%

Table 2: Wholesale electricity prices Jun 2022 (w/o grid charges and other fees) and increase vs. January 2022 for some countries [1].

Figure 5 compares energy cost for operating a glassfiber HEPA filter with an eFRM membrane HEPA filter in different countries under the conditions mentioned above calculated using formula (2).

The different electricity costs in the various countries result in significantly different energy costs for the operation of a filter. In our example, the costs in Italy are about 2.37 times those in Sweden. Independently of this, a cost saving of approx. 50% is shown in each country when using eFRM membrane HEPA filters. Calculating Total Cost of Ownership, according to formula (1) the investment cost for the filters are added to the energy cost. Assuming following investment cost,

Figure 6 shows development of Total Cost of Ownership over time for different countries.

Due to the lower investment costs for the glass fiber filters, their total cost of ownership is initially lower than that of the eFRM membrane filters. However, due to the significantly lower energy costs during operation of the eFRM membrane filters, this ratio reverses over time (Figure 6). The point at which this happens is the so-called break-even point, from which the operation of the higher quality eFRM membrane filters pays off economically. Different energy costs between the countries hardly play a role for that. The payback periods are always in the range of only a few months (Figure 7).

Figure 8 shows the resulting Total Cost of Ownership over the assumed operation time of 18.000h.

Due to different energy cost in the various countries, there are significantly different Total Cost of Ownership for the filters. Independently of this, in all countries there are significant cost savings in the range of 35% up to more than 42%. With the energy consumptions underlying figure 5, the CO2 equivalents shown in Figure 9 can be calculated.

Document Finder
Contacts
Mail
Top of Page